
S
ister Lidia was frustrated. Again! The checks needed to pay the weekly bulletins were not ready. The printing company demanded their pay in a not-so-friendly way and threatened to cancel the service. Lidia was in the middle of the issue without being able to solve it.The pastor called her that morning to see the new bulletin. “They haven’t been delivered,” she explained flustered. “It’s the bank’s fault, and the treasurer, and even the assistant pastor. Why can’t they have things on time?” she protested. “I am tired of letting everyone down.” Lidia’s attitude toward the treasurer and the pastor had deteriorated due to these ongoing inconveniences.
They had such a sharp disagreement that they parted company.
Acts 15:39
Even the holiest of us can be involved in similar conflicts. It happened to Paul and Barnabas – though they didn’t print bulletins in those days. It can also happen to us. The solution lies not in changing the people, but in changing the processes. How? By following these 3 steps to analyze your processes and avoid conflicts.
The relation between conflicts and processes
According to Dan Madison, “The experts in the study of processes state that 85 percent of all problems [within an organization] can be attributed to its processes. The remaining 15 percent is due to its people.”* This can be revealing for a conflictive church: Fix the problematic process before fixing the problematic person.
When there are existing problems within an organization, it is common to try to identify the culprit. The guilt gets passed around like a hot potato from hand to hand, but the issue remains unsolved. Rarely, we stop to think that the process, and not the person, is inadequate or inefficient, and we don’t focus our efforts toward solving it.
Stop and analyze the conflict to determine if the cause is an underlying process..
What is a process?
A process is a sequence of steps followed to achieve a goal. Literally, it means to move forward, hence the word “procession,” much like in the religious processions.
A process moves data from one place to another to produce information, or moves objects from one state to another, transforming them over time to create a product, like, for example, a production line. Or, it can move an authorization to get a signature to produce a check, and a check to produce weekly bulletins.
Processes link people to systems. It does so through the tasks that people carry out as part of their interaction with the system to produce a good or service. Processes produce. A process that produces nothing is useless.
To produce, effective processes are finite, that is, they have a beginning and an end. A poorly scheduled process can make a computer “freeze” and the only solution is to reboot it. The analogy for ministry processes is quite valid. If an issue drains the resources of the church, do not have an end, becomes a vicious cycle, and stresses the pastor, the best course of action will be to end it.
Develop a process mindset. Begin with the final product in mind and trace the steps from its beginning. Follow these 3 effective steps to analyze your processes and correct them.
STEP 1: Create a task list
All processes involve different people executing different tasks. A task list includes:
- Every person involved
- Every system used
- All data and files that need to be compiled
- All information that must be shared
- A definition of the final stage or product
The example in Figure 1 contains a potential task list to produce a Sunday service. Notice how it documents who does what with a certain degree of detail.
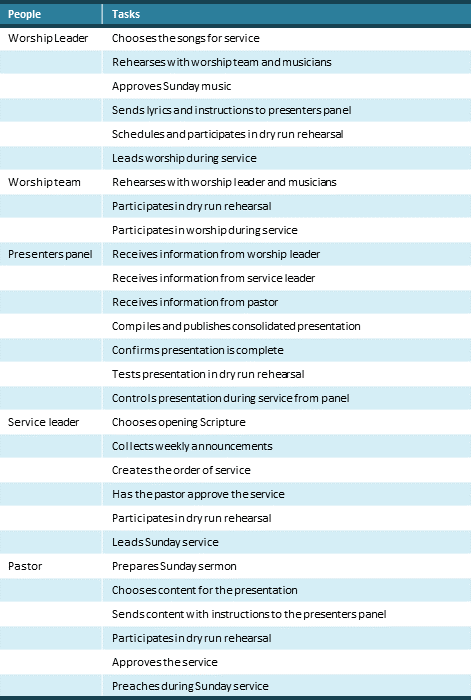
Create a task list. This will allow you to identify all the activities related to the process and move to the second step.
STEP 2: Create a flowchart
I know, the word “flowchart” makes your skin tingle. It sounds complicated. But it doesn’t have to be. Use this simple, but practical way, to make a flowchart.
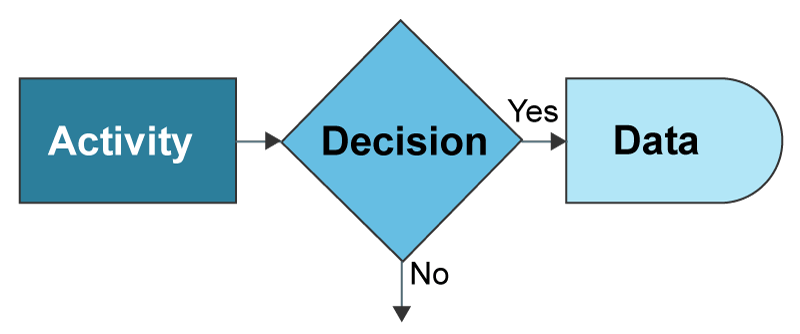
Figure 2, classifies tasks among activities, decisions and information. These tasks can be represented in a visual form by a rectangle, a rhombus, and a bullet, respectively.
In a flowchart, activities are joined by arrows to indicate the flow of the process. Note that the decision rhombus has two possible outcomes and two outgoing arrows, each representing “yes” or “no.”
STEP 3: Assemble the flowchart
To diagram a process, join the map of task list from Figure 1 and the flowchart tasks of Figure 2 to make what is known as Swim Lane Diagram, workflow diagram or flowchart.
This chart takes on the metaphor of a swimming pool separated into lanes. The pool represents the entire process. Each lane represents the roles that each person plays; it is probable that one person may play multiple roles when the organization is smaller in size.
This is how an activity, decision, and data matrix are organized throughout the swim lanes. The arrows not only connect the activities to the decisions and data, but also represent the direction in which the activities flow.
Figure 3 combines both previous steps.
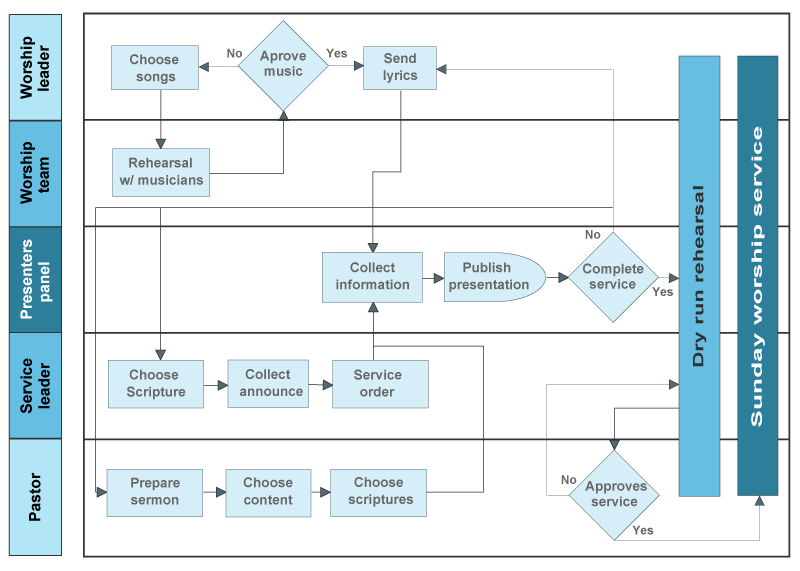
Note that if an activity corresponds to more than one person, the activity may overlap multiple lanes, something which is not allowed in swimming, but it is in flowchart processes diagramming.
In the example, the dress rehearsal and the praise and worship service roles overlap. Also note that the activity “publishes presentation” must produce data. In this case, a file for the presentation thereby using a bullet and not a rectangle. You can be as general, or specific, as you wish. Some activities may be subdivided into various other activities. For example, “the musicians,” may be moved into their own lane.
For an efficient use of technology in ministry, we need to clarify and document its processes. This means delineating, with special attention to detail, how people interact with systems and how they carry out their assigned tasks, make decisions and store information.
When processes are documented in a visual format, your ministry staff can be well-informed and easily find those bottlenecks in which the process gets stuck or delayed. Equipped with this information, you can avoid many conflicts and promote better relationships.
I would like to know if you are using this model in your organization. Sketch a Swim Lane Diagram and share it with me so I can analyze it with you.
How about you, could you identify any conflicts in your ministry that could be caused by bad processes? Do you think you could use this three-step model to identify and overcome your pitfalls?
* Madison, Dan, Process Mapping, Process Improvement and Process Management: A Practical Guide to Enhancing Work and Information Flow, Chico, CA: Paton Professional Press, 2005. p. 3.


Muy útil. Me gustó mucho para aplicarlo personalmente.